

Executive Summary
Diesel prices influence grocery prices through transportation and distribution costs, but the relationship is neither immediate nor uniform because food prices also reflect commodity conditions, perishability, distance, labor, inventories, weather, disease, contracts, and other supply-chain forces. Using normal, uniform, Poisson, and hypergeometric distributions as complementary statistical lenses, this article shows why analysts should distinguish routine price variation, bounded uncertainty, discrete disruptions, and finite-sample composition while also testing product differences and plausible transmission lags rather than treating correlation as causation. USDA evidence from fresh produce and the 2022–2023 egg market further demonstrates that fuel-price sensitivity varies by commodity, route, and origin, and that modeled wholesale-price sensitivity should not be confused with the transportation share of the final retail price.
Keywords: Grocery Prices; Diesel Prices; Statistical Thinking; Supply Chains; Transportation Costs
Context Note: This research note expands an earlier K-GSP Forum newspaper summary, “When Fuel Prices Rise, Consumers Pay Twice,” by developing a fuller statistical and supply-chain analysis of why diesel-price changes do not translate uniformly or immediately into grocery-price changes.
1. Introduction
A local television news reporter recently called me with a seemingly straightforward question: Why are grocery prices changing, and how much of that change is related to diesel prices and trucking costs? The question reflects a common intuition. Groceries must move from farms, processors, and distribution centers to stores, and much of that movement depends on trucks. When diesel prices rise, transportation becomes more expensive, so it seems reasonable to expect grocery prices to rise as well.
Yet the relationship is not that simple. Some grocery products are highly sensitive to transportation costs because they are perishable, refrigerated, or shipped over long distances, while others are influenced more strongly by crop conditions, livestock cycles, labor costs, packaging, processing, inventories, trade conditions, or temporary supply disruptions. As a result, grocery prices may rise, fall, or remain relatively stable even when diesel prices move sharply.
This makes the issue a useful case for statistical thinking. Instead of asking only whether diesel prices affect grocery prices, a more meaningful analysis asks: Which grocery categories are most sensitive? How strong is the relationship? Is there a time lag? What other variables may be influencing prices at the same time? These questions move the discussion beyond simple cause-and-effect reasoning toward a more realistic understanding of variation, correlation, timing, and multiple interacting forces within supply chains.
The purpose of this article is therefore to examine the relationship between grocery prices and diesel prices through a statistical-thinking lens. By comparing transportation-sensitive foods with categories driven more heavily by other factors, the analysis shows why grocery prices do not always move together with diesel prices and why understanding supply-chain inflation requires attention to patterns, exceptions, and context (Chang et al., 2024; Dillon & Barrett, 2016; Zingbagba et al., 2020).
2. Contextual Overview: Grocery Prices and Diesel Prices
Grocery and diesel prices are connected through a multistage supply chain—from production, processing, packaging, and warehousing to transportation, distribution, and retail—but grocery prices also respond to weather, commodity markets, labor, inventories, disease, trade, and consumer demand, making the relationship neither immediate nor uniform—therefore, analysis should focus on the transmission mechanisms linking the two rather than assuming that grocery prices automatically move with diesel prices (USDA ERS, 2026a, 2026b; EIA, 2026).
2.1. Grocery Prices: The Outcome of Multiple Cost Drivers
Grocery prices represent the final consumer-facing outcome of a complex supply chain that incorporates agricultural inputs, processing, packaging, labor, energy, transportation, storage, wholesale distribution, and retail costs. The relative importance of these factors varies by product, with fresh and perishable foods often requiring faster and temperature-controlled transportation, while canned foods, pasta, and cereals can generally be stored and moved more flexibly. Food prices are also affected by product-specific supply shocks, including weather, animal disease, drought, labor shortages, and packaging constraints. As a result, the overall grocery-price index combines many different market dynamics, so statistical analysis should examine individual food categories as well as aggregate averages to avoid masking important differences (USDA ERS, 2026a, 2026b; Dillon & Barrett, 2016).
2.2. Diesel Prices: A Key Cost of Truck-Based Food Distribution
Diesel fuel is a critical input in food supply chains because trucking connects farms, processors, warehouses, distribution centers, and retail stores, so higher diesel prices can raise carrier operating costs and eventually affect freight rates, fuel surcharges, and distribution expenses. Refrigerated transportation is especially exposed because perishable foods require both continuous vehicle movement and temperature control, making long-distance shipments generally more sensitive to fuel-price changes than locally sourced or easily stored products. At the same time, diesel prices are themselves volatile and respond to crude-oil markets, refining capacity, inventories, seasonal demand, geopolitical disruptions, and energy policy, while trucking costs also reflect wages, equipment, insurance, maintenance, congestion, capacity, and freight demand. Diesel should therefore be treated as an important input within the transportation system rather than as a complete measure of trucking or grocery distribution costs (EIA, 2026; Chang et al., 2024; Volpe, 2014).
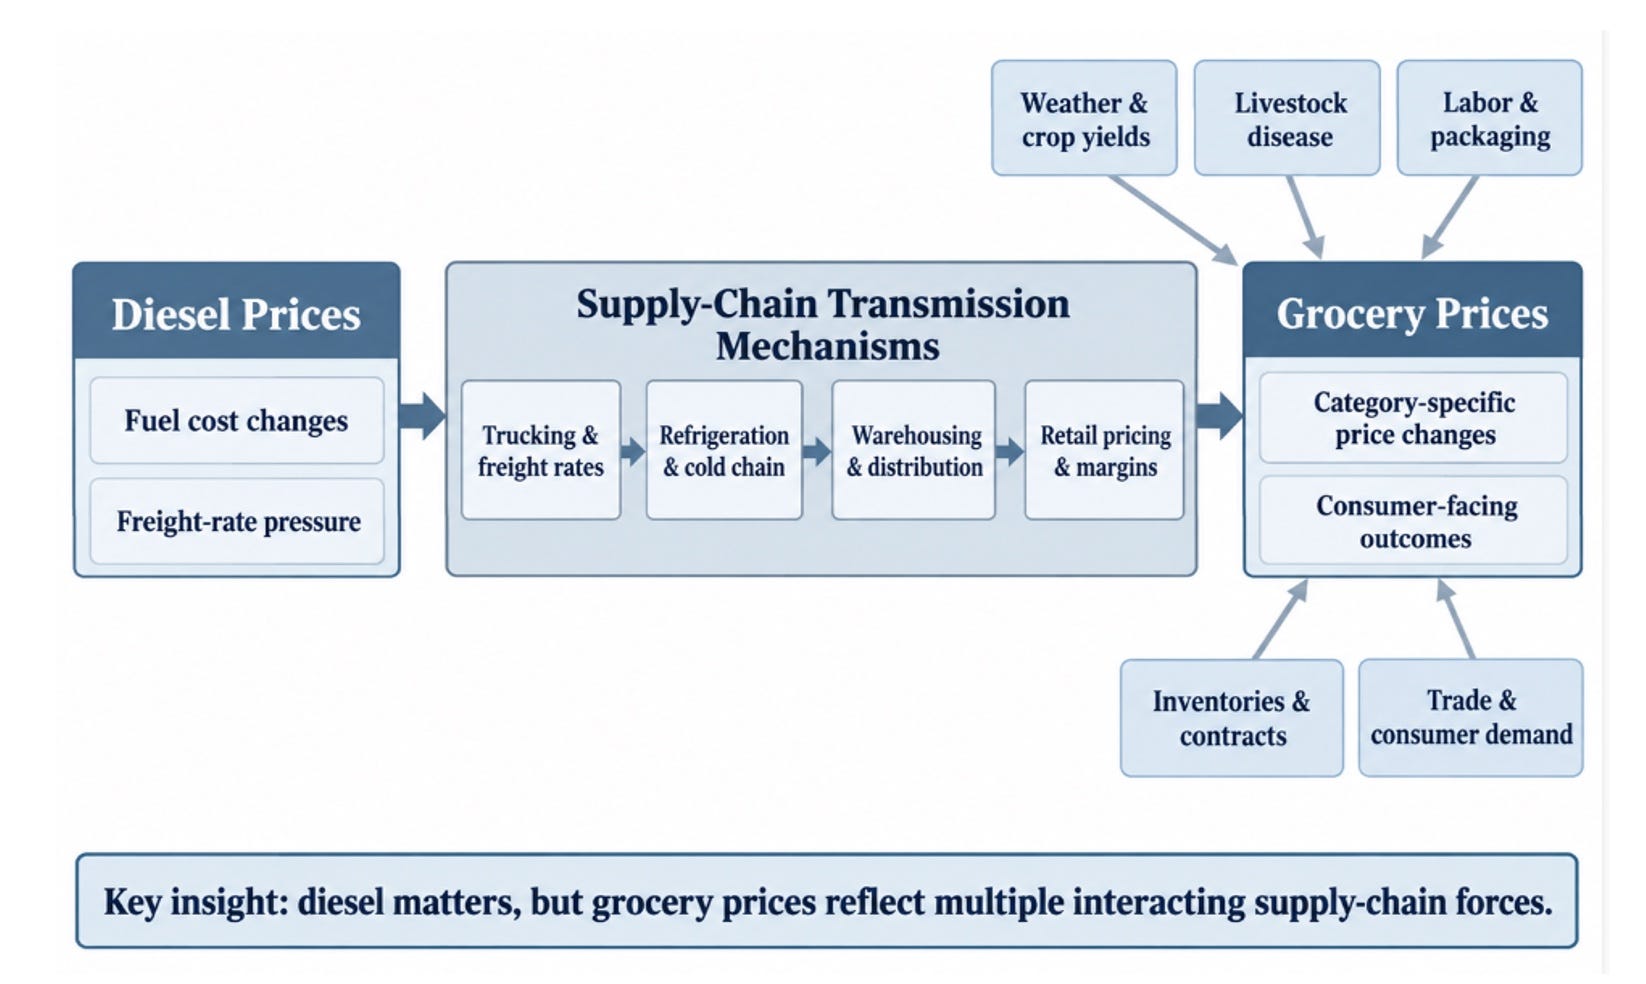
Figure 1 illustrates how changes in diesel prices can influence grocery prices through a sequence of supply-chain transmission mechanisms, including trucking and freight rates, refrigeration and cold-chain operations, warehousing and distribution, and retail pricing and margins. It also shows that grocery prices are simultaneously affected by other important factors such as weather and crop yields, livestock disease, labor and packaging costs, inventories and contracts, and trade conditions and consumer demand. The framework therefore emphasizes that higher diesel prices may place upward pressure on grocery prices, but the final consumer price reflects the combined effects of multiple supply-chain and market forces. The key insight is that diesel prices matter, but grocery-price movements should be understood as the outcome of an interacting system rather than as a simple one-to-one response to fuel costs.
Figure 1
Grocery Prices, Diesel Prices, and Supply Chain Transmission
Source: Author’s Own Synthesis
2.3. Grocery Prices and Diesel Prices
Higher diesel prices can raise transportation costs and place upward pressure on grocery prices, but the effect is rarely immediate because higher fuel expenses typically pass through trucking rates, distributor or wholesaler costs, and only later to retail prices. Retailers may delay or soften this transmission by using existing inventories, renegotiating contracts, absorbing part of the cost increase, or adjusting margins, so grocery-price responses may emerge only after several weeks or months. The strength of the relationship also varies by product, with long-distance fresh produce often more exposed to diesel costs, while eggs, meat, and packaged foods may be driven more strongly by disease, livestock and feed cycles, or processing and packaging expenses. Statistical analysis should therefore examine correlation, time lags, product-specific differences, confounding factors, and structural shocks before drawing conclusions about how much diesel prices explain grocery-price movements (Chang et al., 2024; Dillon & Barrett, 2016; Volpe, 2014; Zingbagba et al., 2020).
3. Statistical Distributions and the Grocery–Diesel Price Relationship
Diesel–grocery relationships are better understood through statistical distributions than through a single average or correlation coefficient, because normal, uniform, Poisson, and hypergeometric distributions capture different forms of routine variation, bounded uncertainty, discrete events, and finite-sample composition, providing complementary lenses for interpreting grocery prices, supply-chain disruptions, and differences in transportation sensitivity. These distributions are used here as illustrative analytical lenses matched to different questions; the article does not claim that each distribution has been empirically fitted to the observed grocery-price data.
Figure 2
Four Statistical Distributions for Interpreting Diesel and Grocery Price Relationships
Source: Author’s Own Synthesis
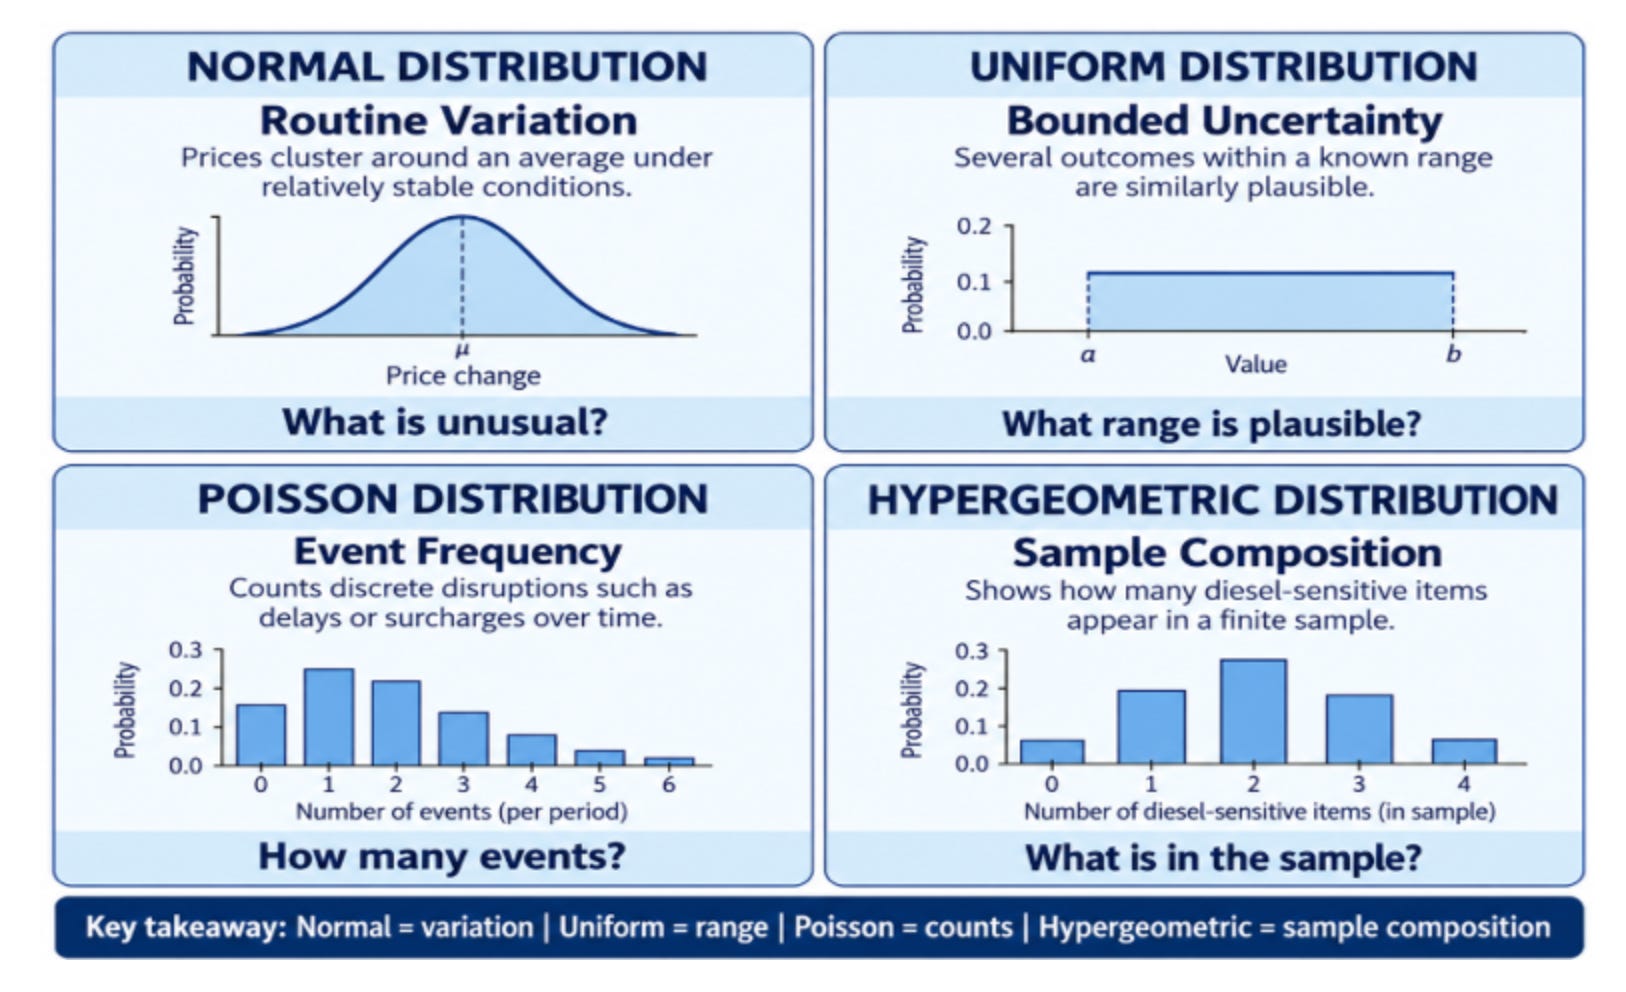
Figure 2 presents four statistical distributions as different lenses for interpreting how diesel prices and grocery prices may behave under different analytical conditions. The Normal Distribution represents routine price variation around an average and is useful for understanding relatively stable monthly changes in a broad grocery-price index. The Uniform Distribution captures situations in which several pass-through outcomes are treated as equally plausible, while the Poisson Distribution shows how to model the number of discrete events such as delivery delays, freight surcharges, or cold-chain disruptions within a given period. The Hypergeometric Distribution highlights finite-sample analysis by showing the probability that a selected sample of grocery categories or shipment routes contains several highly diesel-sensitive items, reinforcing the broader point that diesel–grocery relationships can be studied through multiple statistical perspectives.
3.1. Four Statistical Distributions, Four Supply-Chain Situations
Normal distribution captures routine variation around an average under relatively stable conditions, so the key question is whether a grocery-price change is typical or unusual based on the mean and standard deviation. Uniform distribution represents bounded uncertainty when several outcomes within a known range are similarly plausible, encouraging analysts to report a credible range rather than force a single-point estimate.
Poisson distribution focuses on event frequency, such as the number of delivery delays, freight surcharges, or cold-chain disruptions occurring within a given period. Hypergeometric distribution addresses sample composition by examining how many diesel-sensitive products or routes appear in a finite sample selected without replacement, reminding analysts that measured sensitivity can change depending on which items are included.
3.2. A 2×2 Statistical Distribution Framework
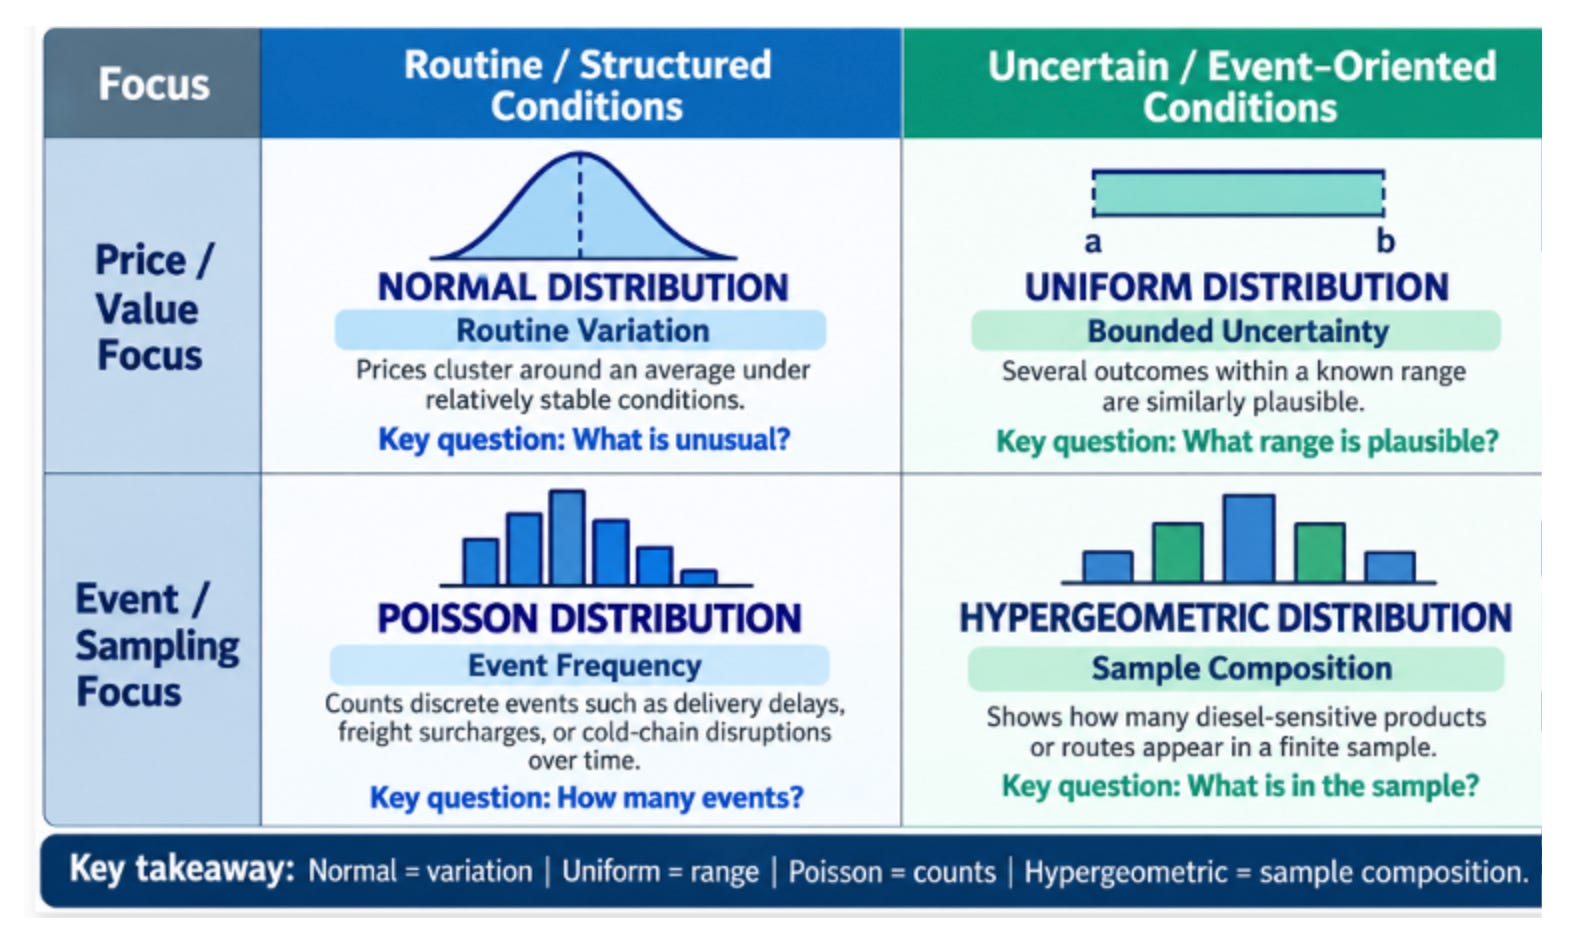
The four distributions can be organized using two dimensions: what is being observed—a price/value or an event—and whether the environment is relatively routine or characterized by uncertainty/event occurrence.
Figure 3 presents a 2×2 statistical framework for interpreting diesel–grocery price relationships by organizing the analysis along two dimensions: price/value focus versus event/sampling focus and routine/structured conditions versus uncertain/event-oriented conditions. In the first row, the Normal Distribution explains routine price variation under relatively stable conditions, while the Uniform Distribution highlights situations in which several pass-through outcomes are treated as similarly plausible within a bounded range. In the second row, the Poisson Distribution focuses on the frequency of countable disruptions such as delivery delays or freight surcharges, whereas the Hypergeometric Distribution emphasizes finite-sample composition by showing how measured diesel sensitivity depends on which grocery categories or shipment routes are included in the sample. Overall, the table shows that diesel and grocery price relationships can be interpreted through different statistical lenses depending on whether the key issue is variation, range, event counts, or sample composition.
This framework emphasizes that no single probability distribution should be imposed on every grocery-price problem. The appropriate distribution depends first on the question being asked. Analysts studying routine price variation require a different model from those counting supply-chain disruptions or examining how the composition of a finite sample changes the observed degree of diesel sensitivity.
Figure 3
Four Statistical Lenses for Grocery-Diesel Relationships: Different Questions Call for Different Distributions
Source: Author’s Own Synthesis
3.3. Statistical Thinking: Matching the Distribution to the Question
The grocery–diesel relationship illustrates a central principle of statistical thinking: the statistical model should be selected to fit the phenomenon being studied, not imposed in advance. A normal distribution can describe routine price variation around an average, a uniform distribution can represent a bounded range of similarly plausible outcomes, a Poisson distribution can model the frequency of transportation disruptions, and a hypergeometric distribution can examine the composition of a finite sample of grocery categories or shipment routes. These perspectives help explain why higher diesel prices do not translate mechanically into higher grocery prices, because fuel costs operate within a system characterized by routine variation, uncertainty, discrete events, product differences, and delayed responses. The more meaningful statistical questions are therefore not simply whether diesel prices increased, but what type of variation is occurring, which distribution best represents it, and what conclusions can reasonably be drawn from that model.
Diesel prices matter—but grocery prices are shaped by the whole supply chain, not by fuel alone.
4. Applying Statistical Thinking to Grocery–Diesel Price Relationships
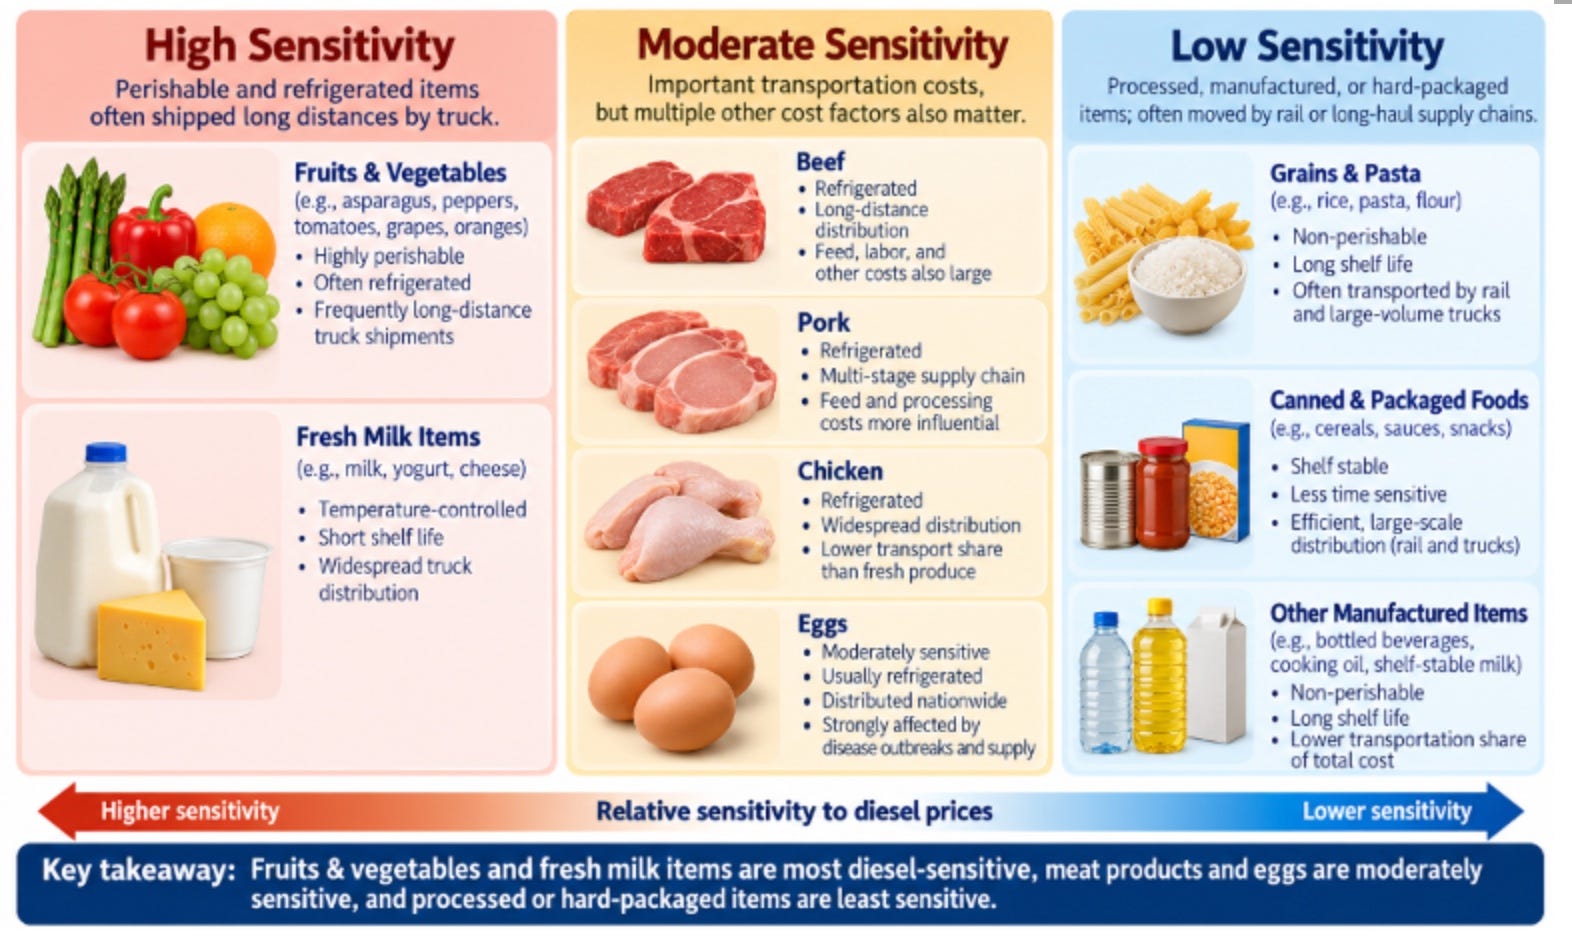
Statistical thinking becomes most useful when probability concepts are connected to actual supply-chain conditions. Figure 4 highlights three broad patterns of diesel-price sensitivity: high sensitivity among fresh fruits, vegetables, and fresh milk products; moderate sensitivity among meat products and eggs; and lower sensitivity among manufactured, processed, or hard-packaged shelf-stable products. These categories are not fixed rankings, but they provide a practical way to understand how perishability, refrigeration, shipping distance, production cycles, processing, storage flexibility, and transportation mode shape the degree to which diesel-cost changes may influence grocery prices.
4.1. Correlation, Causation, and Competing Supply Shocks
Correlation is a starting point, not a conclusion. In 2022, food-at-home prices rose 11.4%, but that increase occurred alongside avian influenza, the war in Ukraine, higher fertilizer and commodity costs, and broader inflationary pressures, so simultaneous increases in fuel and grocery prices do not establish diesel as the primary cause (BLS, 2023; USDA ERS, 2023b). Egg prices provide a particularly useful illustration: transportation and refrigeration matter, but the sharp 2022–2023 price movements were driven more directly by avian influenza, flock losses, and subsequent supply recovery, supporting their placement in Figure 4 as moderately rather than highly diesel-sensitive (USDA ERS, 2023a, 2023c; Chang et al., 2024).
4.2. Route, Time-Lag, and Product Heterogeneity
USDA research on fresh produce shows that transportation sensitivity varies by shipping distance, route, origin, commodity, and mode of transportation rather than operating uniformly across markets. For routes from California’s San Joaquin Valley to major U.S. cities, diesel-price effects on trucking rates were statistically significant for the examined routes except the relatively short Los Angeles route, while cost changes may pass through trucking rates, wholesaler costs, and retail pricing only after successive supply-chain stages; accordingly, contemporaneous relationships should be examined together with plausible time lags rather than assuming immediate pass-through (Volpe, 2014; Chang et al., 2024).
Product heterogeneity is therefore central to Figure 4. Fresh fruits, vegetables, and fresh milk products tend to be more diesel-sensitive because they are perishable, often refrigerated, frequently replenished, and less able to wait for favorable transportation conditions; beef, pork, chicken, and eggs occupy a moderate category because transportation and cold-chain costs interact with feed prices, herd or flock cycles, disease, processing, and other production factors. Manufactured, processed, canned, dry, or hard-packaged products tend to be less immediately diesel-sensitive because they have longer shelf lives, greater storage flexibility, and more opportunities for consolidated or multimodal long-haul movement before final truck delivery; where rail is available, it can further reduce direct dependence on long-distance trucking, although the article’s cited USDA evidence does not provide a product-by-product rail sensitivity estimate (Chang et al., 2024; Volpe, 2014; Zingbagba et al., 2020).
Figure 4
Illustrative Grocery Product Groups by Relative Diesel-Price Sensitivity
Source: Author’s Own Synthesis
4.3. Sensitivity Tiers and the Cost-Share Distinction
Figure 4 therefore organizes grocery products into three useful sensitivity tiers. High sensitivity includes fresh produce and fresh milk, where perishability, refrigeration, short shelf life, and frequent truck movement increase transportation exposure; moderate sensitivity includes meat products and eggs, where diesel matters but competes with feed, biological cycles, processing, disease, and cold-chain requirements; and low sensitivity includes more heavily processed or shelf-stable packaged goods, where storage flexibility and less urgent transportation reduce immediate pass-through from diesel prices. These groupings should be interpreted as relative tendencies because season, origin, route, contracts, and supply disruptions can shift a product’s actual sensitivity.
Most importantly, price sensitivity is not the same as transportation cost share. A modeled 20–28% wholesale-price response to a doubling of oil prices does not mean transportation accounts for 20–28% of the final supermarket price: cost share asks how the consumer dollar is allocated across activities, whereas price sensitivity asks how strongly price changes when a particular input changes. The practical lesson from Figure 4 is therefore that analysts should distinguish how exposed a product is to transportation costs, how strongly its price responds to fuel-cost changes, and how much transportation actually represents in the final retail price (USDA ERS, 2026b; Volpe, 2014; Zingbagba et al., 2020).
4.4. External Shocks and Policy Uncertainty
Future grocery-price movements may be shaped increasingly by geopolitical shocks that operate through energy, fertilizer, grain, shipping, and trade channels rather than through diesel prices alone. A war involving Iran or a serious disruption around the Strait of Hormuz could raise crude-oil, fertilizer, shipping, and transportation costs, while the Russia–Ukraine war has already shown how energy and agricultural disruptions can coincide with food-price pressures. Research on oil-to-food price transmission also shows that energy shocks can reach food markets through transportation and other supply-chain channels rather than through one direct mechanism. These events reinforce the article’s central statistical lesson: grocery inflation can emerge from multiple interacting shocks, so an observed increase in food prices should not automatically be attributed to diesel costs alone (EIA, 2026; USDA ERS, 2023b, 2026a; Dillon & Barrett, 2016).
The 2026 U.S. midterm elections add a different form of uncertainty because agricultural and food markets may respond to changing expectations about tariffs, trade relationships, farm programs, energy policy, and other government measures, even though the election itself is not a direct grocery-price variable. Such expectations can matter because food prices are shaped by trade conditions, energy costs, supply availability, and broader market pressures. From a statistical perspective, these geopolitical and policy developments should therefore be treated as external shocks or conditioning variables that can alter the relationship among diesel prices, transportation costs, commodity markets, and final grocery prices rather than as deterministic predictors of consumer food inflation (USDA ERS, 2026a; EIA, 2026).
5. Conclusion
Diesel prices matter, but grocery prices emerge from a network of interacting forces—transportation, perishability, production cycles, disease, inventories, trade, energy, and geopolitical shocks—rather than from fuel costs alone. Statistical thinking helps distinguish routine variation, plausible ranges, event frequency, and sample composition while also showing that diesel sensitivity differs across products, with fresh fruits, vegetables, and milk generally more exposed, meat and eggs moderately exposed, and processed or shelf-stable products less immediately exposed. Geopolitical disruptions involving the Middle East and Russia–Ukraine, together with policy uncertainty surrounding trade, energy, agriculture, and the U.S. midterm elections, can further alter fuel, fertilizer, grain, shipping, and food-price relationships without producing a simple one-to-one effect. The central lesson is therefore clear: do not ask only whether diesel prices move grocery prices; ask when, where, for which products, through which supply-chain mechanisms, under which external shocks, and by how much (Chang et al., 2024; Dillon & Barrett, 2016; USDA ERS, 2026a, 2026b; EIA, 2026; Volpe, 2014; Zingbagba et al., 2020).
References
Bureau of Labor Statistics. (2023). Consumer Price Index—December 2022. U.S. Department of Labor. https://www.bls.gov/news.release/archives/cpi_01122023.htm (accessed September 24, 2026).
Chang, A. J., Zhou, F., El-Rayes, N., & Shi, J. (2024). Food transportation and price impacted by diesel price and truck-driver shortage pre-, amid and post pandemic. Transportation Research Part E: Logistics and Transportation Review, 192, 103794. https://doi.org/10.1016/j.tre.2024.103794
Dillon, B. M., & Barrett, C. B. (2016). Global oil prices and local food prices: Evidence from East Africa. American Journal of Agricultural Economics, 98(1), 154–171. https://doi.org/10.1093/ajae/aav040
U.S. Department of Agriculture, Economic Research Service. (2023a). Avian influenza outbreaks reduced egg production, driving prices to record highs in 2022. https://www.ers.usda.gov/data-products/charts-of-note/105576
U.S. Department of Agriculture, Economic Research Service. (2023b). Retail food price inflation in 2022 surpassed 2021 rates in most categories. https://www.ers.usda.gov/data-products/charts-of-note/105676
U.S. Department of Agriculture, Economic Research Service. (2023c). Wholesale egg prices tumble as egg supplies recover. https://www.ers.usda.gov/data-products/charts-of-note/106845
U.S. Department of Agriculture, Economic Research Service. (2026a). Food Price Outlook. https://www.ers.usda.gov/data-products/food-price-outlook
U.S. Department of Agriculture, Economic Research Service. (2026b). Food Dollar [Data product]. https://www.ers.usda.gov/data-products/food-dollar
U.S. Energy Information Administration. (2026). Gasoline and Diesel Fuel Update. https://www.eia.gov/petroleum/gasdiesel/ (accessed September 24, 2026).
Volpe, R. (2014). Impact of oil prices on produce prices depends on route and mode of transportation. Amber Waves. U.S. Department of Agriculture, Economic Research Service. https://www.ers.usda.gov/amber-waves/2014/january-february/impact-of-oil-prices-on-produce-prices-depends-on-route-and-mode-of-transportation (accessed September 24, 2026).
Zingbagba, M., Nunes, R., & Fadairo, M. (2020). The impact of diesel price on upstream and downstream food prices: Evidence from São Paulo. Energy Economics, 85, 104531. https://doi.org/10.1016/j.eneco.2019.104531
ABOUT THE AUTHOR

Paul C. Hong — Distinguished University Professor, University of Toledo
Paul C. Hong is a Distinguished University Professor of Information Systems and Supply Chain Management and an affiliated faculty of Asian Studies Program at the University of Toledo. His work focuses on leadership, governance, and decision-making in the AI era, integrating strategy, technology, and institutional trust. He has published extensively in leading academic journals and writes on how individuals and organizations navigate complexity, disruption, and global transformation.
Original Article:

Suggested Citation
Hong, P. C. (2026, September 29). Why grocery prices do not always move with diesel prices: A statistical thinking perspective on supply chains. K-GSP Forum, pp. 1–11.
한글요약
왜 식료품 가격은 항상 디젤 가격과 함께 움직이지 않는가: 공급망에 대한 통계적 사고의 관점
이 글은 “디젤 가격이 오르면 운송비가 증가하므로 식료품 가격도 함께 올라야 한다”는 직관적인 가정에서 출발하지만, 실제 식료품 가격은 훨씬 복합적인 공급망 요인의 결과라고 설명한다. 식료품 가격은 농산물 원가뿐 아니라 가공, 포장, 노동, 에너지, 운송, 보관, 도매·소매 유통비의 영향을 받으며, 날씨, 작황, 가축 질병, 재고, 국제무역, 소비자 수요도 동시에 작용한다. 특히 신선 과일·채소와 우유처럼 부패 가능성이 높고 냉장·장거리 운송 의존도가 큰 품목은 디젤 가격 변화에 상대적으로 민감한 반면, 육류와 달걀은 사료비, 생산주기, 질병, 가공비와 같은 다른 요인의 영향도 크게 받는다. 따라서 디젤 가격은 중요한 비용요인이지만 식료품 가격을 단독으로 결정하는 변수는 아니며, 공급망 전체의 상호작용을 함께 살펴보아야 한다.
이러한 관계를 이해하기 위해 이 글은 통계적 사고와 네 가지 확률분포를 활용한다. 정규분포는 비교적 안정적인 환경에서 평균을 중심으로 나타나는 일상적 가격 변동을, 균등분포는 정보가 충분하지 않을 때 일정 범위 안의 여러 결과가 비슷하게 가능하다고 보는 상황을 설명한다. 포아송분포는 일정 기간 동안 발생하는 운송 지연, 긴급 운임 할증, 콜드체인 중단과 같은 사건의 횟수를 분석하는 데 적합하며, 초기하분포는 한정된 식료품 품목이나 운송경로 가운데 디젤 가격에 민감한 항목이 표본에 얼마나 포함되는지를 설명한다. 핵심은 하나의 통계모형을 모든 상황에 적용하는 것이 아니라, 가격 변동, 불확실한 범위, 사건 빈도, 표본 구성이라는 서로 다른 질문에 맞는 분포를 선택하는 데 있다.
역사적 사례는 이러한 통계적 사고의 필요성을 더욱 분명하게 보여준다. 2022년 미국의 식료품 가격과 디젤 가격이 동시에 높은 수준을 보였지만, 달걀 가격 급등은 조류 인플루엔자에 따른 산란계 감소와 공급 부족의 영향을 크게 받았기 때문에 단순한 동시 움직임을 인과관계로 해석해서는 안 된다. 또한 신선 농산물의 경우 운송거리, 출발지, 경로, 운송수단에 따라 디젤 가격 민감도가 달라지며, 신선 과일·채소와 우유는 상대적으로 높은 민감도, 쇠고기·돼지고기·닭고기와 달걀은 중간 수준의 민감도, 가공식품·통조림·건조식품·장기보관 포장식품은 상대적으로 낮은 직접 민감도를 보일 수 있다. 이러한 차이는 전체 식료품 평균보다 품목별 이질성과 공급망 구조를 분석하는 것이 더 중요함을 보여준다.
마지막으로 식료품 가격은 국내 공급망 요인뿐 아니라 외부 충격에도 영향을 받을 수 있다. 중동의 지정학적 불안과 이란 관련 충돌 가능성은 원유, 비료, 해운, 운송비를 통해 식료품 가격에 영향을 줄 수 있으며, 러시아–우크라이나 전쟁 역시 에너지와 농산물 시장의 불확실성을 높일 수 있다. 미국의 중간선거와 관련한 무역, 에너지, 농업정책의 변화 가능성도 직접적인 가격 결정요인은 아니지만 시장 기대와 공급망 조건에 영향을 줄 수 있으므로 외생적 충격이나 조건변수로 다루는 것이 적절하다. 결국 이 글의 핵심 메시지는 단순하다. “디젤 가격이 식료품 가격을 움직이는가?”라고 묻는 데서 멈추지 말고, 언제, 어디서, 어떤 품목이, 어떤 공급망 경로와 외부 충격을 통해, 얼마나 영향을 받는가를 물어야 한다.
Paul C. Hong
Paul C. Hong은 미국 University of Toledo의 Distinguished University Professor로 Information Systems and Supply Chain Management 분야에서 연구와 교육을 수행하고 있으며, Asian Studies Program의 affiliated faculty이기도 하다. 그의 연구는 공급망과 전략을 비롯해 리더십, 거버넌스, 기술, AI 시대의 의사결정과 제도적 신뢰를 연결하는 데 중점을 두고 있다. 그는 다수의 학술논문과 저술을 통해 개인과 조직이 복잡성, 위기, 기술 변화, 글로벌 공급망 충격에 어떻게 대응하는지를 연구하고 있다.
© K-Global Schoalrs and Professionals Forum. All rights reserved. Content published in the K-GSP Forum may not be reproduced, distributed, or transmitted in any form without prior written permission from the K-GSP Forum, except for brief quotations with full attribution.